
D3D12 APITrace - Capture and Replay

The past week, I have been working on an APITrace implementation for Direct3D 12, primarily for use for developing VKD3D-Proton (a D3D12->Vulkan translation layer.)
 Joshua-Ashton
This work may be useful for people who are developing games or working on implementing a D3D12 driver or translation layer for debugging purposes.
Being able to replay the commands an application issued consistently is very useful for debugging purposes such as catching and fixing obscure bugs reproducibly, debugging game/GPU hangs and bisecting against older/newer driver versions or testing reproducibility on different hardware.
You can also RenderDoc a specific frame consistently every time which is useful for in our case, translation, because we can see how generated SPIR-V and other state has changed between versions or just in general.
You can also attach a debugger on replay which helps a lot to diagnose crashes with most modern games' DRM and anti-cheat mechanisms being very unfriendly to attaching a debugger to them.
Another benefit is introspection, with qapitrace you can easily see every call, per-frame. You can see all the pipeline state, every memcpy to mapped memory and what the data was, and the state of every fence - everything is recorded.
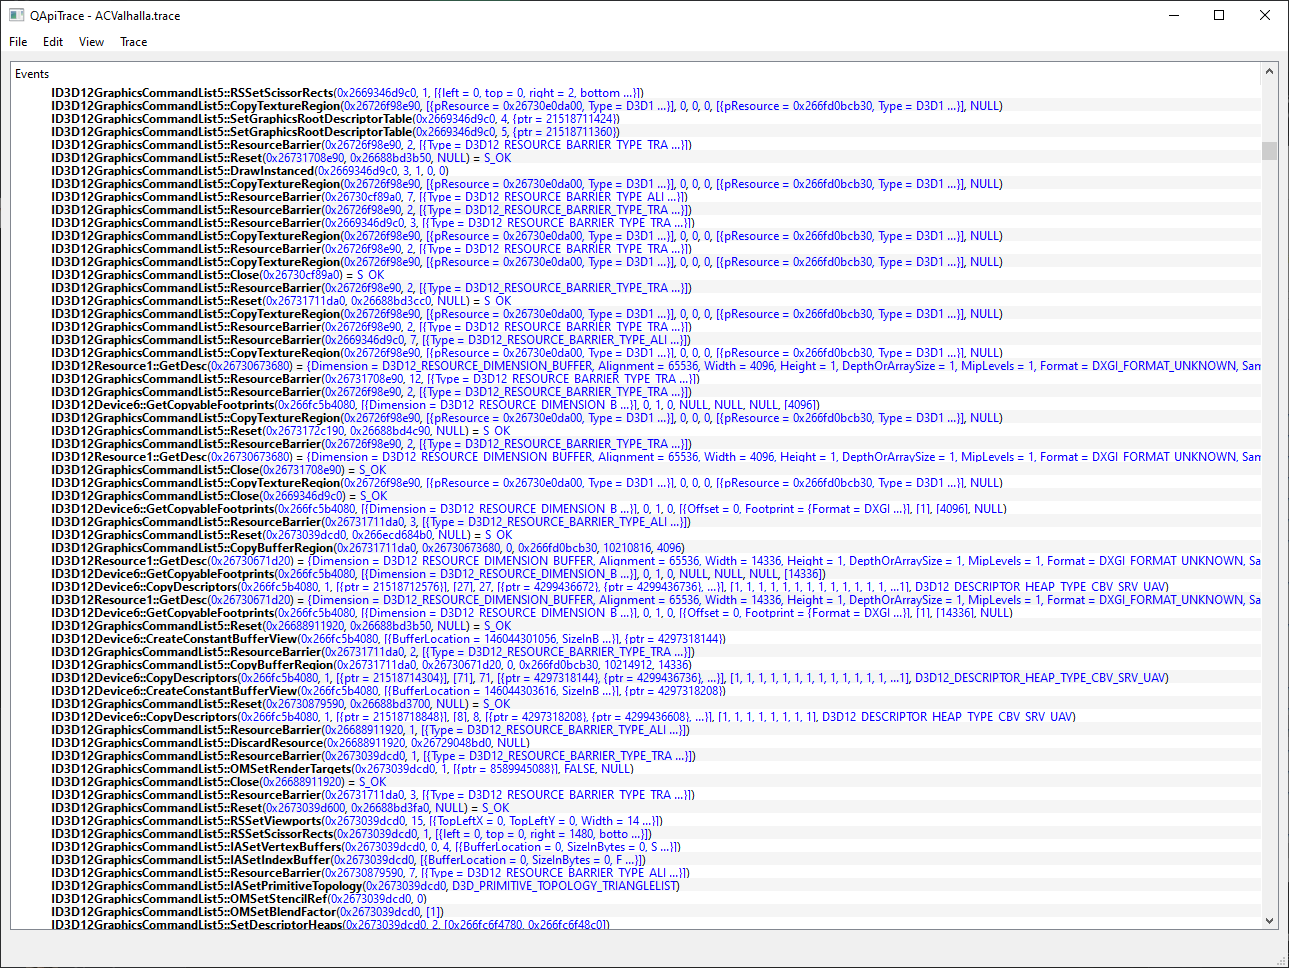
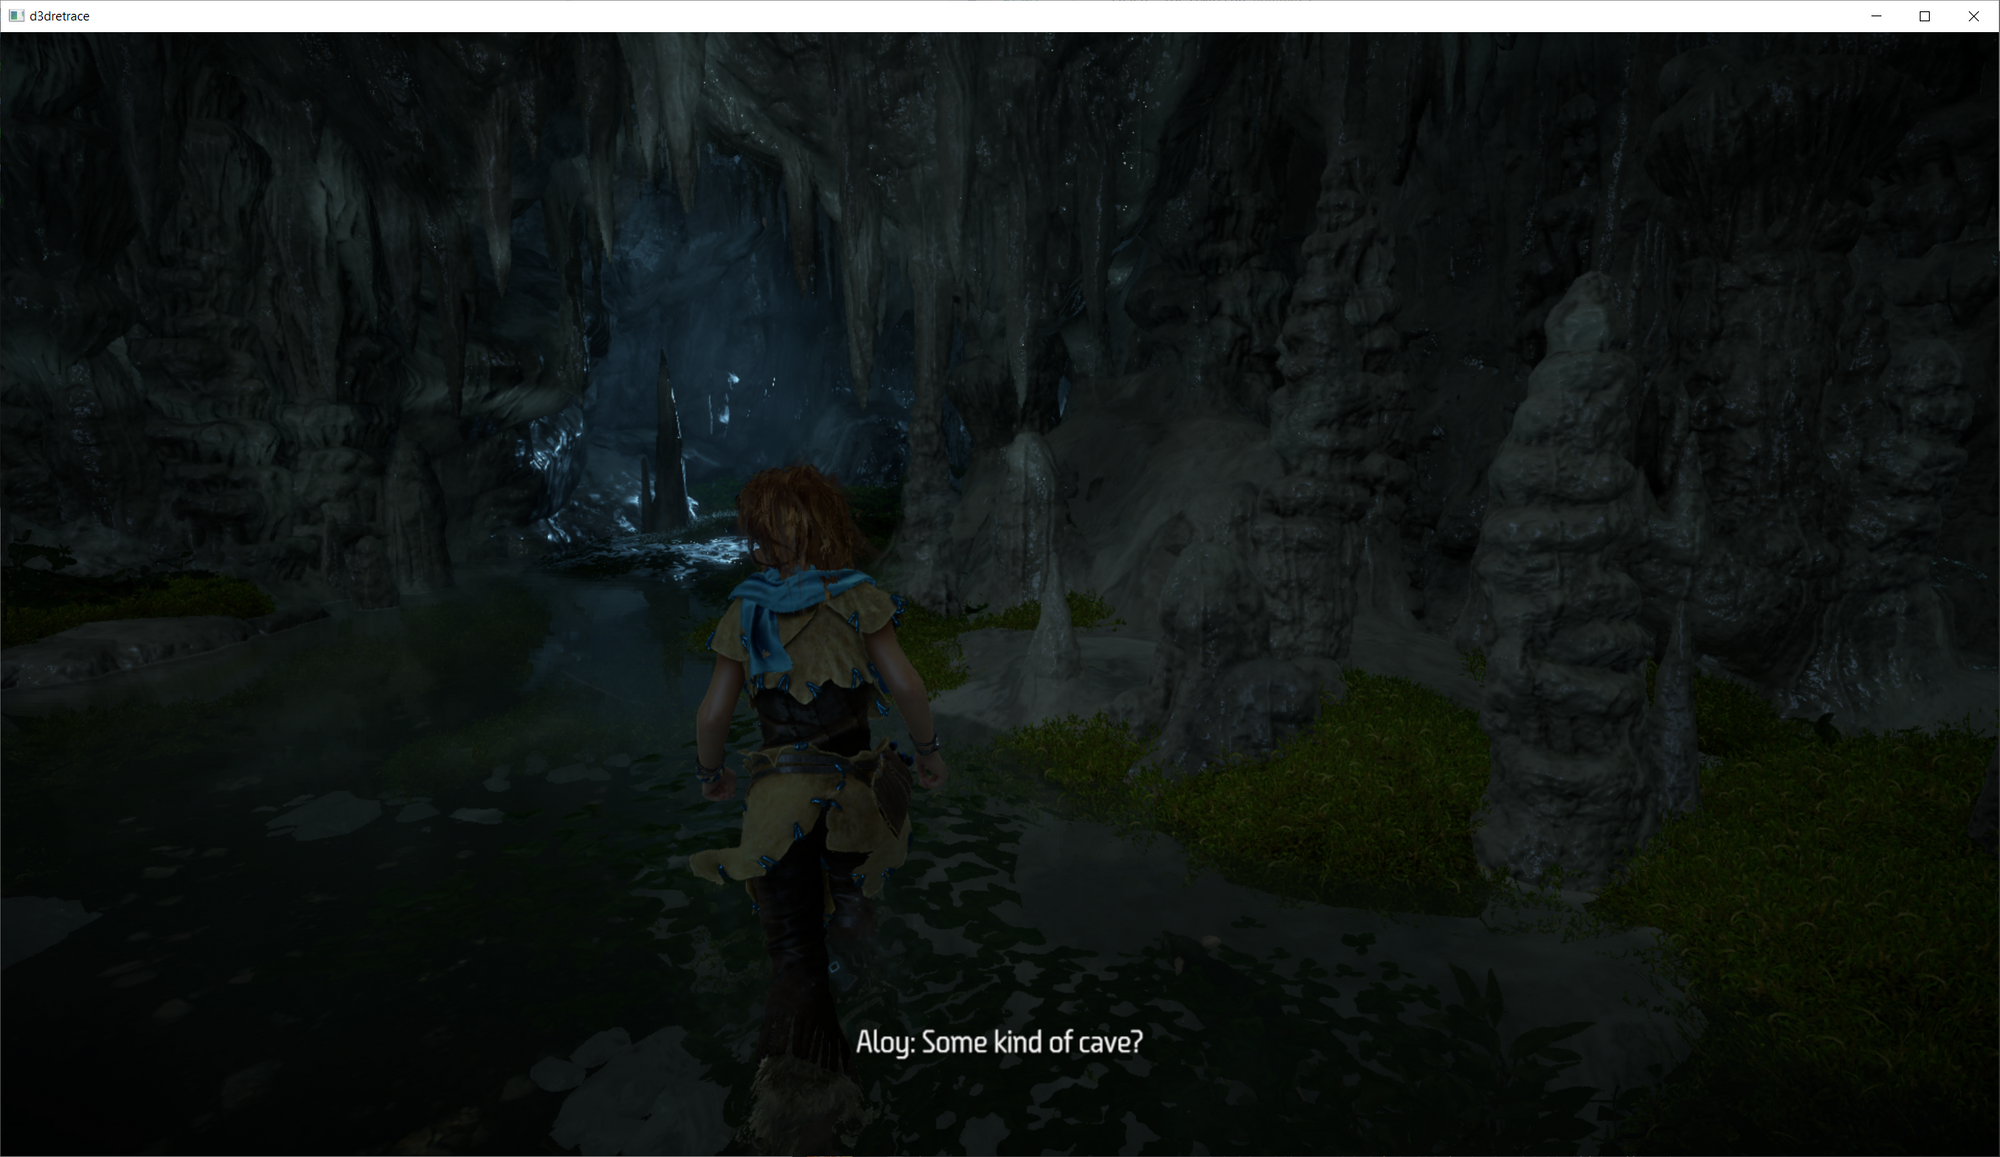
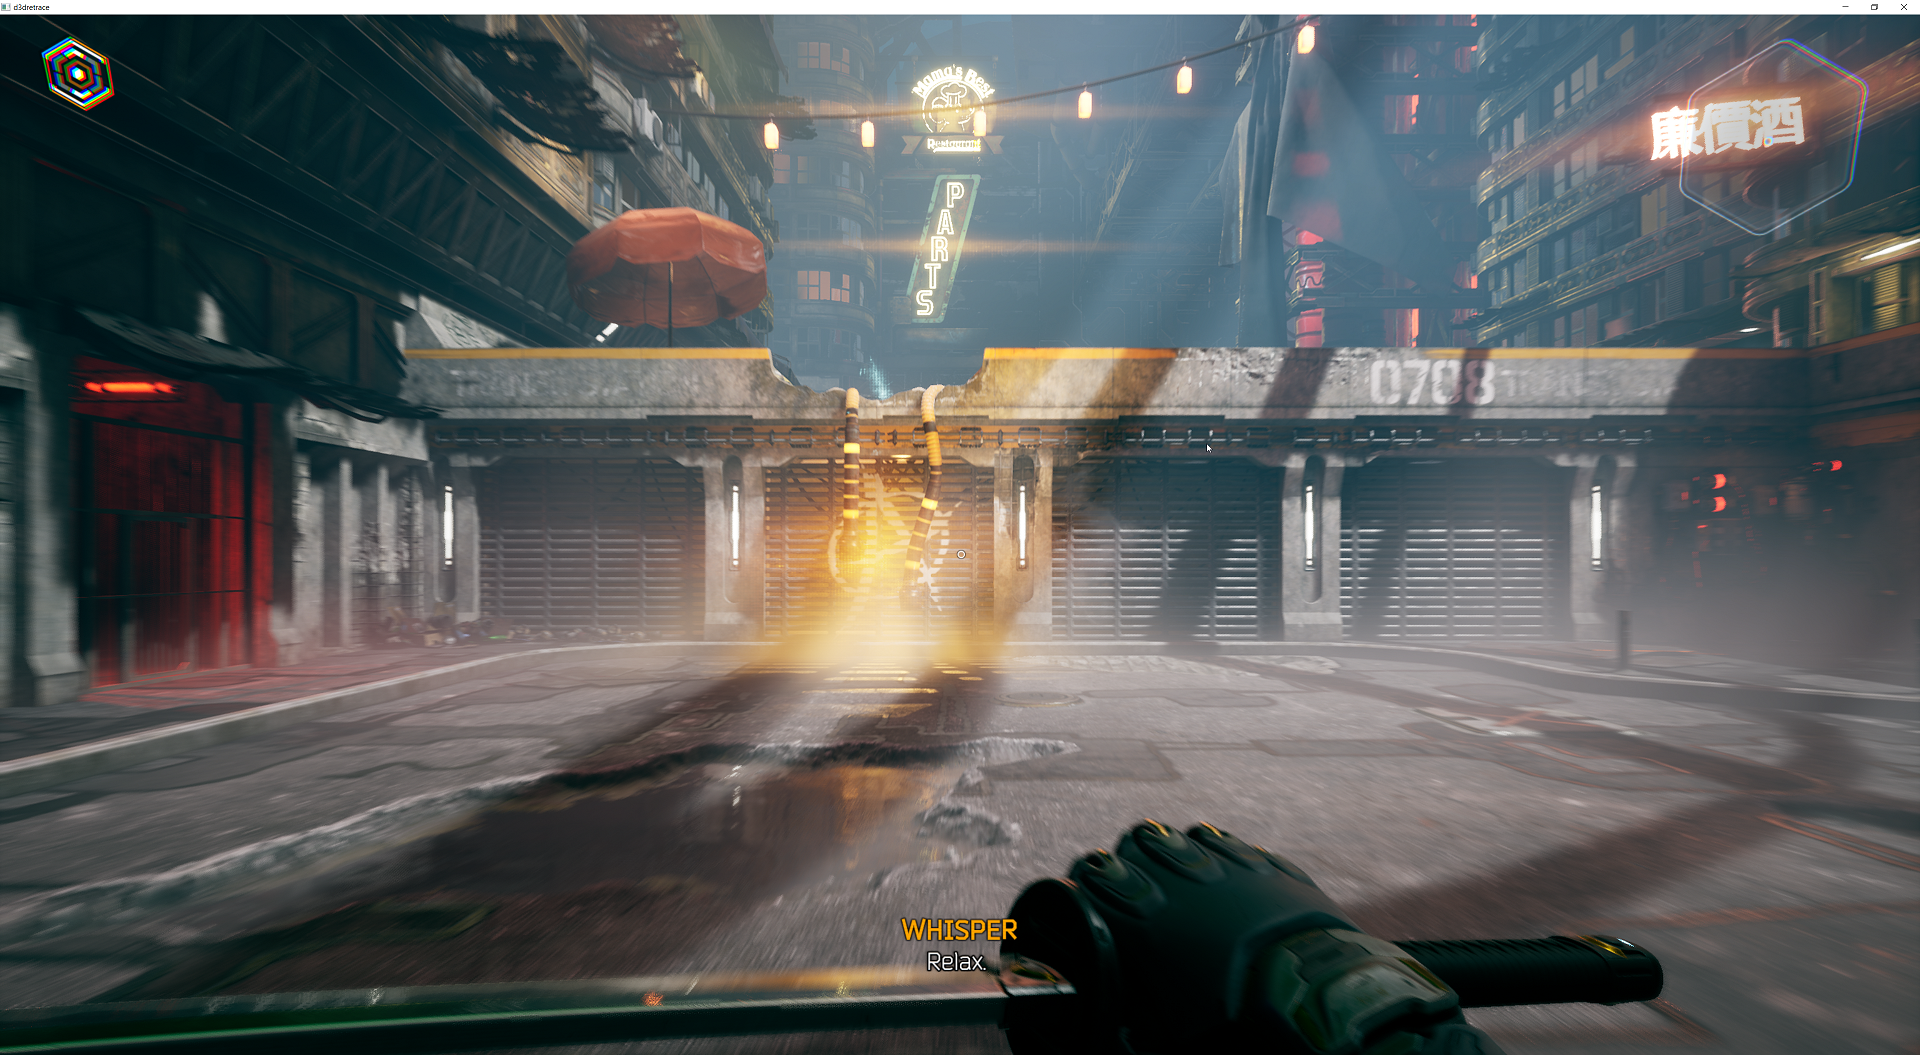
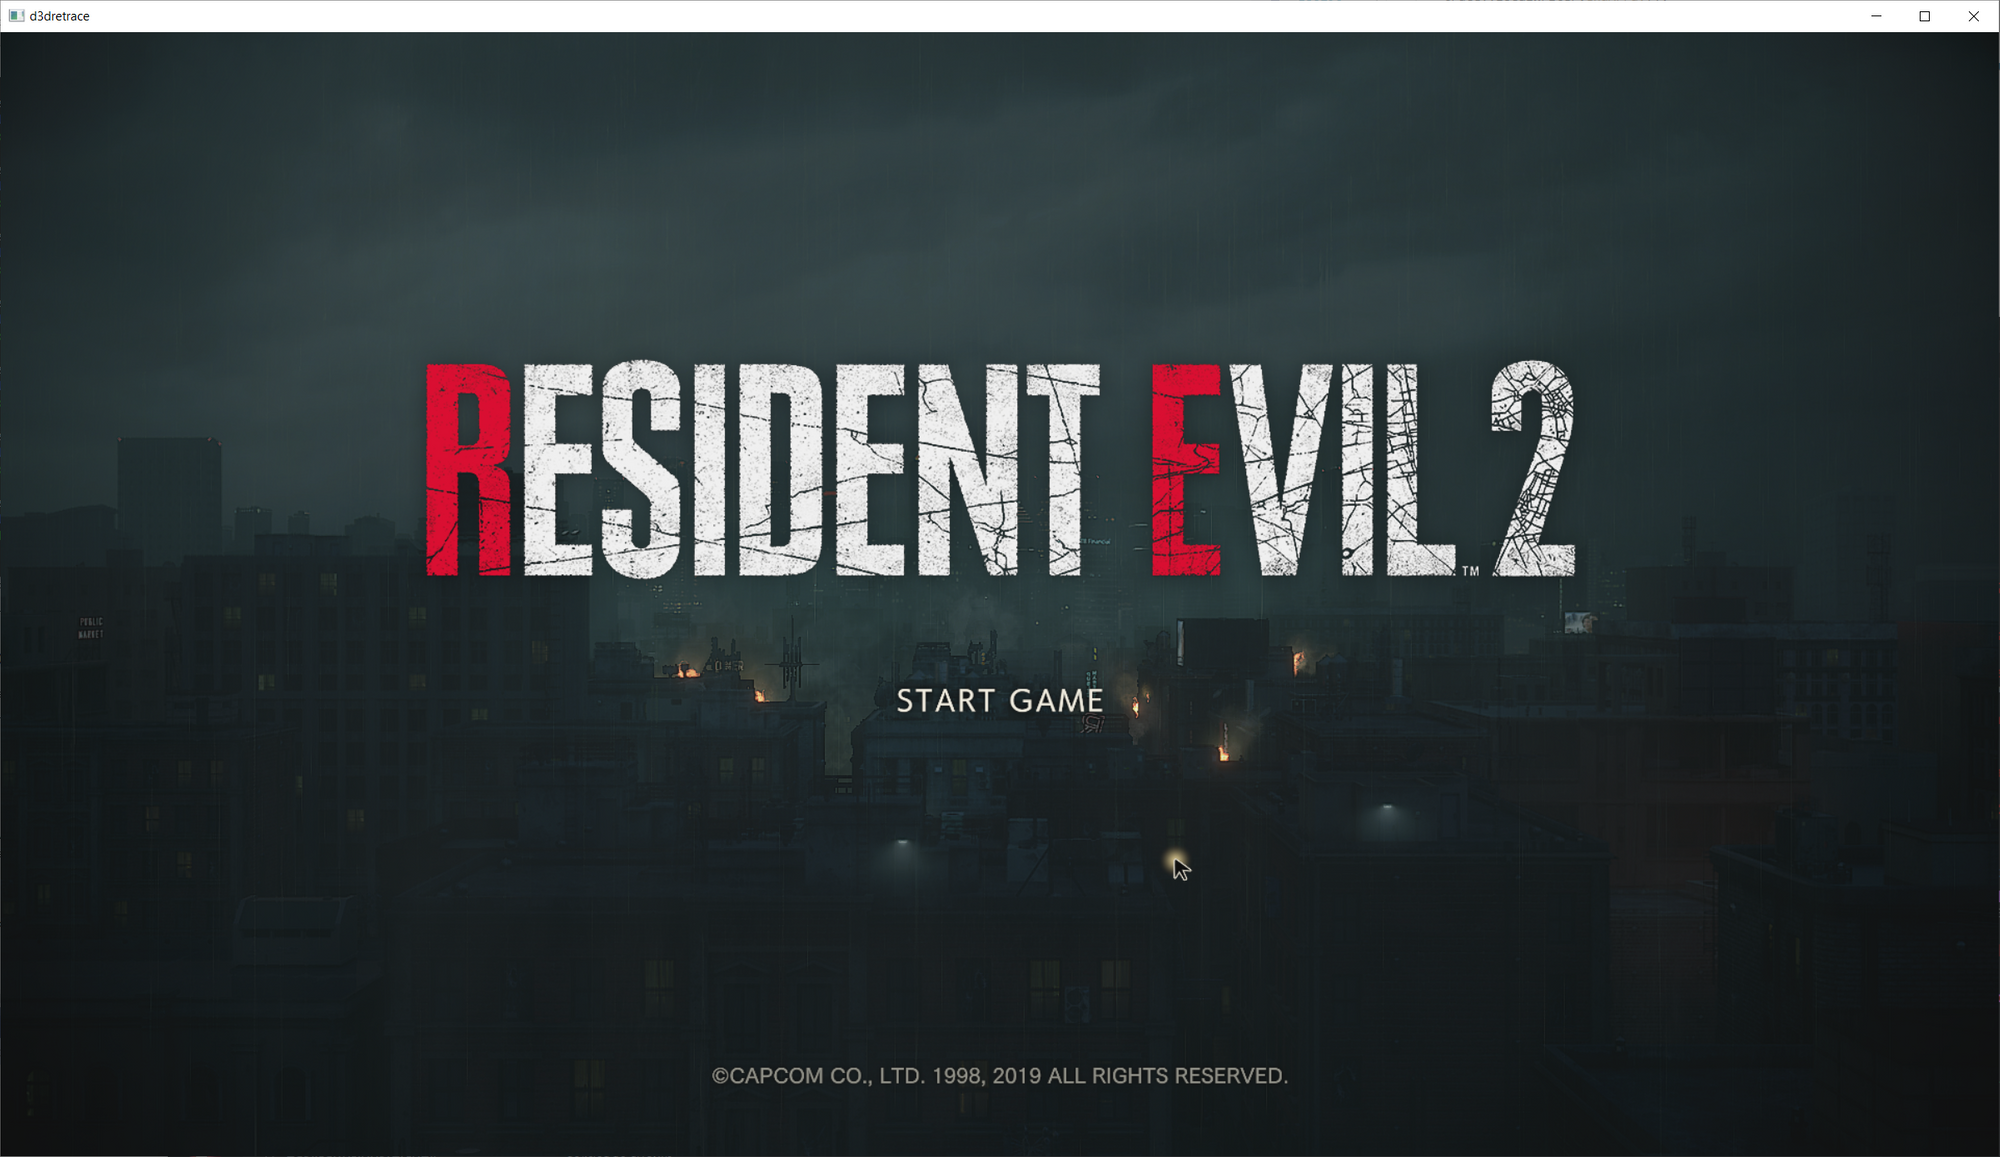
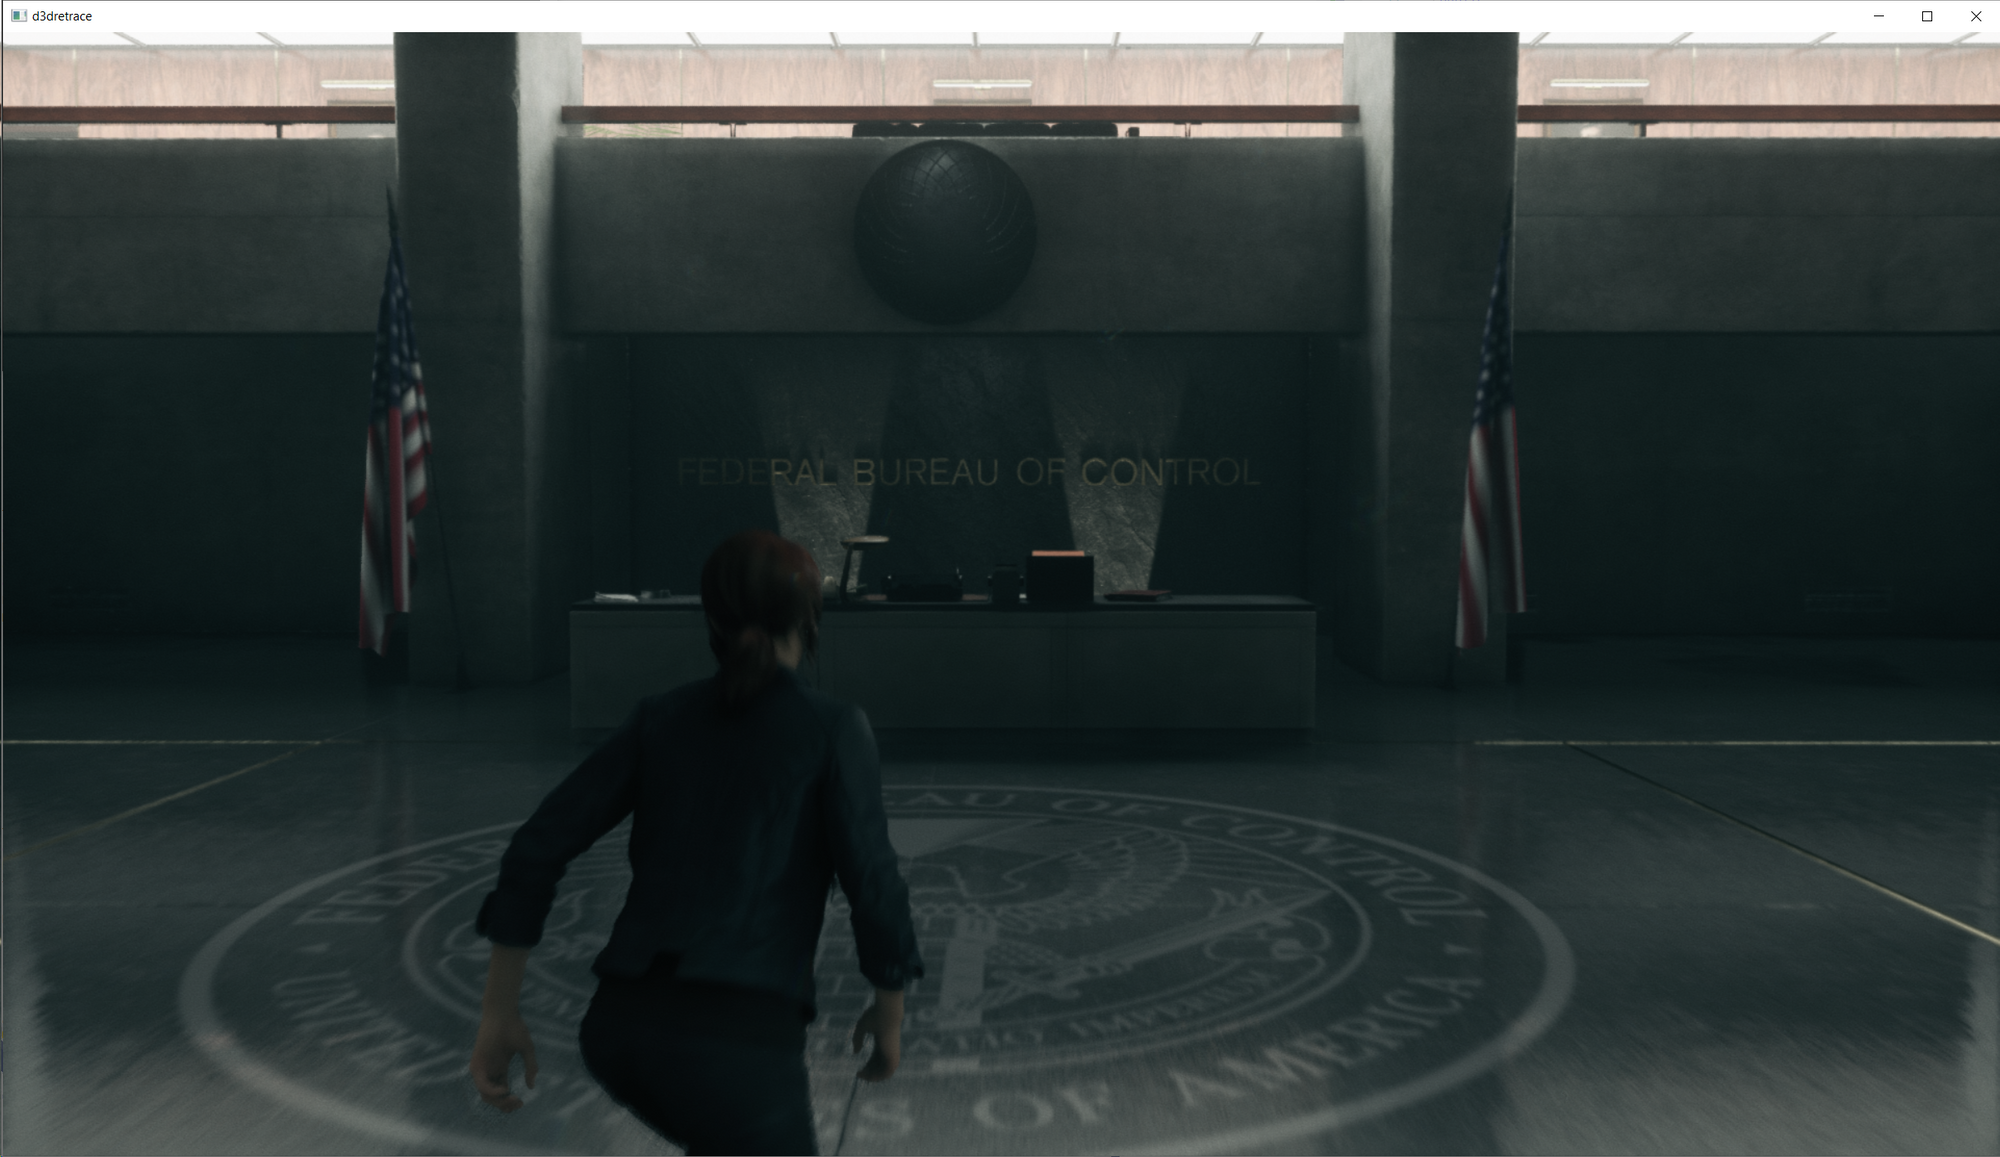
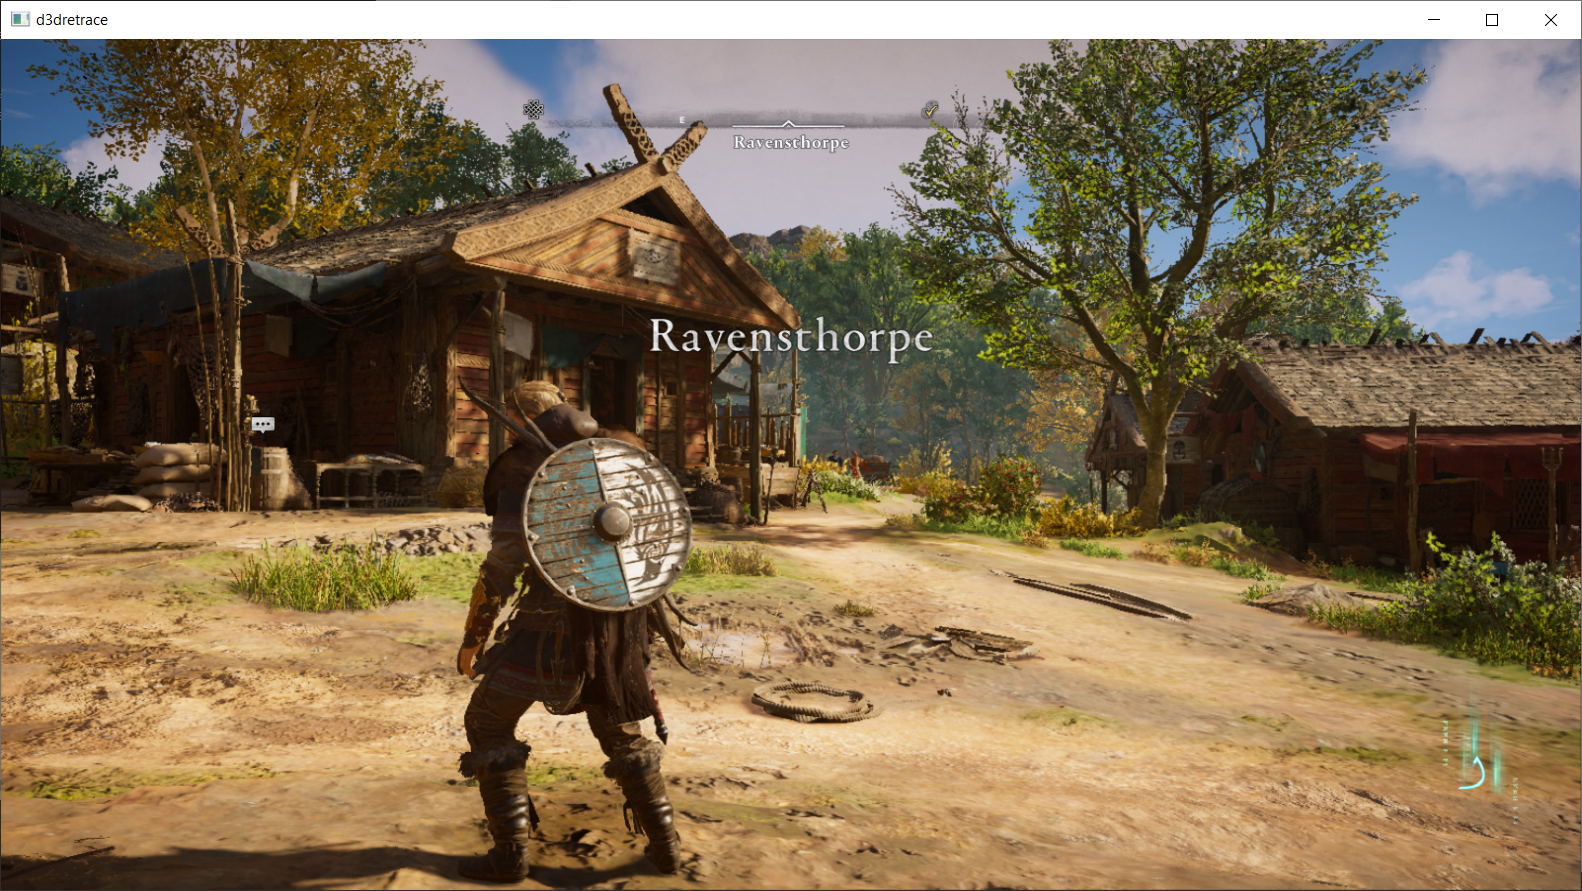
Although I've only been working on this for about a week, I've had a lot of success in getting many big games working with it, such as Horizon Zero Dawn, Assassin's Creed Valhalla, Control, Ghostrunner and Resident Evil 2 to name a few.
The trace files are relatively small for what they are (1-3GB), the main chunk of the size comes from the initial loading of a level. They also compress very well, usually to about 75% to 50% of their original size.
I've already managed to track down and fix a few bugs, such as singleton device behaviour, and a bug with copying reserved resources, in vkd3d-proton by replaying games this way. It makes it incredibly easy to find the exact call things break on with the entire call history being clearly visible, and being able to debug without the game's anti cheat or DRM complaining at you.
Download
I've done an initial release here: Alpha 1 which should be useful enough for you to try out with quite a few games and applications, despite this early stage.
Joshua-AshtonThere are still some known issues right now such as:
- ImportExistingHeapFromAddress/File doesn't work
- Raytracing doesn't work
- D3D11On12 doesn't work
Please make sure to disable the Steam Overlay if trying to record a trace as it uses D3D11on12 and won't work.
Please feel free to report any bugs you find with it, though! I'd be very much appreciated.
Below is a write-up of all the technical parts that were problems and challenging along the way, if this does not interest you, feel free to skip to the conclusion at the end.
Some Terminology
- VA = Virtual Address
- IAT = Import Address Table
The Problem Space
There are several new problems that need to be addressed when capturing and replaying D3D12 compared to other, older APIs.
- Persistent Memory Mapping - The application can keep a resource mapped while it's in use by the GPU, unlike other APIs like D3D11 and D3D9 where mapping a resource will wait until it's finished being in use on the GPU, etc.
- Descriptor Handles - The application is given CPU and GPU "descriptor handles" by the API for it to increment and pass in to different parts of the API for ie. copying resource descriptors, binding root descriptor tables, or clearing depth stencils.
- GPU Virtual Addresses - The application can get the raw GPU VA for a resource (ie. a buffer) and that's used by quite a few methods on the device/command list for binding or creating views, etc.
- Raytracing (DXR) - This comes with it's own set of problems due to it needing GPU VAs in buffers of which I will go into detail of later...
- Device/vendor agnosticism - A lot of limits in D3D12 are vendor or device specific, such as image space requirements, etc.
- Fences and synchronization - D3D12 allows you to signal a Win32 event whenever a fence reaches a certain value.
- Dealing with API jank - There are a few very poorly designed parts of the D3D12 API which also surprisingly don't serialize very well, such as
CreatePipelineStatewhich takes in a polymorphic stream of types and respective structures with very funky alignment rules. Some changes were also needed to deal withconststructures which contained COM object pointers (which obviously don't work asconstever.)
The Solution Space 🐸
Persistent Memory Mapping
D3D12 (and other APIs like Vulkan) allow you to keep resources (buffers, etc) persistently mapped to CPU VA space. This is problematic because in all other APIs that APITrace supports, when you either Unmap or UnlockRect a resource, that's when we know the app is done writing to it and we can queue up a memcpy of the previously mapped region for replay.
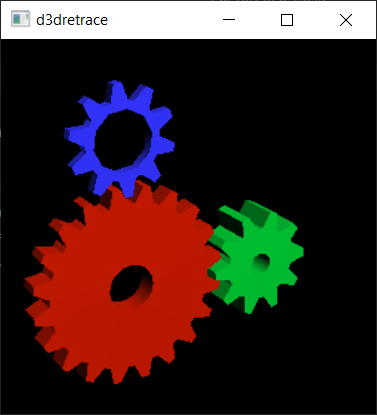
My initial solution was very horrible. It involved exception handling using protections on the mapped memory for the size of the resource. This is incredibly slow, (although fast enough to run basic games and demos like vkd3d-gears or Delores) but it worked to get things off the ground.
There are two types of ways you can go about this Access Violation (PAGE_NOACCESS) or Page Guards (PAGE_GUARD). TL;DR: PAGE_GUARD is better than PAGE_NOACCESS because the kernel handles unprotecting for you, which avoids needing to set a trap for the next instruction to be executed and to unprotect it yourself there, because we're only dealing with page granularity (4kb on Windows) for our memcpys, this worked out fairly well.
When the application mapped any memory, I added the resource and the mapped ptr to a hashmap and I issued a VirtualProtect to change the permissions of the mapped region to PAGE_GUARD | PAGE_READ_WRITE, which means whenever a page is written to it triggers an exception. I then wrote an exception handler to handle when something was written to one of these protected pages and add it's index to a list of dirty pages. When the application either Unmaps the specific resource or calls ExecuteCommandLists (for all mapped resources), I would queue up a memcpy of all the dirty pages and, in the latter case, re-protect the mapped memory for next time.
There is one... slight problem that hit me with this. When attempting to VirtualProtect any memory allocated with WRITE_COMBINE, it will succeed and it won't actually change anything. This bug was really annoying because doing a VirtualQuery straight after shows that this thing didn't work at all and I was lied to! It's not too hard to work around (just using changing the heap descs to use HEAP_CUSTOM and WRITE_BACK) but it's really annoying that you get completely LIED to that things worked when they didn't. I guess that's just Windows for you... 🙃
And... TADA!
However, there is a much better solution! (and I was an idiot for doing the first one)
GetWriteWatch is great! It solves this problem much better than my crappy exception handling solution from before.
This function allows you to see what pages have been dirtied since the last time you called it or ResetWriteWatch. However there is a caveat: You must allocate the memory with MEM_WRITE_WATCH, initially I had this grand idea of allocating my own memory with this, and importing it with OpenExistingHeapFromAddress and managing it that way, but there was a much simpler solution which is to use D3D12_HEAP_FLAG_ALLOW_WRITE_WATCH, which does that for me (how convenient).
I also did not have to disable WRITE_COMBINE on the heap with this flag enabled, and VirtualQuery still shows it being there.
I then implemented my own tracking using this which worked surprisingly well! It took some fiddling to get the contiguous page setup working but in the end it came out kinda clean:
static inline void _flush_mapping_watch_memcpys(_D3D12_MAP_DESC& mapping)
{
    static std::vector<uintptr_t> s_addresses;

    constexpr size_t PageSize = 4096;
    size_t watch_size = align(mapping.Size, PageSize);
    size_t address_count = watch_size / PageSize;
    s_addresses.resize(address_count);

    DWORD granularity = DWORD(PageSize);
    ULONG_PTR count = ULONG_PTR(address_count);

    // Find out addresses that have changed
    if (GetWriteWatch(WRITE_WATCH_FLAG_RESET, mapping.pData, watch_size, reinterpret_cast<void**>(s_addresses.data()), &count, &granularity) != 0)
    {
        ... error handling ...
    }

    for (ULONG_PTR i = 0; i < count; i++)
    {
        uintptr_t base_address = s_addresses[i];

        // Combine contiguous pages into a single memcpy!
        ULONG_PTR contiguous_pages = 1;
        while (i + 1 != count && s_addresses[i + 1] == s_addresses[i] + PageSize)
        {
            contiguous_pages++;
            i++;
        }

        // Clip to this resource's region
        uintptr_t resource_start = reinterpret_cast<uintptr_t>(mapping.pData);
        size_t size = contiguous_pages * PageSize;
        size = std::min(base_address + size, resource_start + mapping.Size) - base_address;

        trace::fakeMemcpy(reinterpret_cast<void*>(base_address), size);
    }
}
Another minor issue that came up along the way was some apps call Map multiple times -- I'm assuming from other threads. This was a simple fix though, I just needed to refcount Map/Unmap like D3D12 does, only removing it from the hashmap once all refs had been released.
I still kept the original exception handling method around because there are other ways of creating a D3D12 heap such as from a user pointer with OpenExistingHeapFromAddress, which I have no control over the allocation of.
Capturing and Replaying Descriptors
D3D12 has descriptor heaps of a given descriptor type and returns a "descriptor handle" for the start of the heap which then is offset by the user as an index into the heap.
This is problematic for capture and replay because there are no guarantees that we get the same descriptor handle for the start of the descriptor heap on replay, this is just an opaque value that the application offsets (although it probably is implemented as CPU and GPU VAs respectively, but there's no guarantee for that.)
Initially, I treat it like it was a CPU VA; I allocated my own 4GB aligned block of CPU VA with MEM_RESERVE, however Windows does not have a public API for allocating memory with such a large alignment, so I actually allocated 8GB of VA and found a 4GB aligned block inside of it and returned that, that way I can use the lower 32-bits as an offset into the heap, and look up the upper 32-bits in a hash map/table to find the original descriptor handle/resource, etc.
offset = handle 0xFFFFFFFF;
index  = handle >> 32;
(some readers may ask "well, why not use VirtualAlloc2?", however this API requires GetProcAddress to link to it, and specifying an alignment of 4GB will simply just fail silently and return nullptr.)

This solution worked well enough for the initial bringup of a few applications but fails for a few reasons:
- We're allocating 8GB! For 32-bit applications that's double of the entire address space!
- This is incredibly expensive to deal with for every descriptor heap allocated and freed
- It just feels... really wrong to abuse real CPU VA space like this.
However, there is a much better solution! (and I was an idiot for doing the first one)
Going back to the initial description we can see that it's simply just an opaque value that's offset. The application can't treat it like CPU VA cause it has no idea what it actually is in the implementation (even if it had that guarantee, it couldn't do anything useful anyway as descriptors are implementation-specific.)
For this reason I implemented my own lock-free implementation for mapping descriptor heap handles, which used the same trick with the index and offset: It works by having a large array of real handles, and incrementing an atomic counter for each descriptor heap allocated which gives us the index of the heap into the array. If the counter ever overflows the bounds of the array, I'm planning to have a (slow) hashmap + mutex fallback.
This works much better and is what's being used now.
GPU Virtual Addresses and The Raytracing Caveat
GPU Virtual Addresses have a very similar solution to descriptor handles. I use the exact same lock-free allocator and look up in the same way, which works very well for everything except raytracing (DXR).
Essentially, the problem is that in DXR, you can put GPU VAs in buffers (like a pointer) which are then dereferenced by the GPU. This is a big problem because we aren't actually giving the app real GPU VAs here, so it's going to end up reading garbage memory! Oh no.
The only thing I can do is patch the DXIL and add in a page table which is... yeah no. That's an incredible feat; DXIL is basically just LLVM bitcode, patching that is already basically impossible and injecting my own page table that's used for every pointer de-reference is a massive feat.
So, I don't have a solution for this right now. In fact, I don't think there is one (a sane one) right now - but, I can propose one:
Vulkan Capture BDAs
Having something akin to Vulkan Capture BDAs in D3D12 would be great and make a lot of things a lot cleaner.
This essentially makes it so that when you ask for a GPU VA for a resource at capture time you get one that is very far out and unlikely to have a collision with another, then, on replay, you pass in the VA you got when capturing and you get the same one back! Magical~ ✨
This isn't available everywhere in the Vulkan world right now, but I hope this feature becomes common-place, because it'd not only be useful for APITrace, but will also be imperative for developers and driver vendors (ie. RADV) for debugging applications using raytracing down the line.
D3D12 debugging tools such as RenderDoc and probably Microsoft's PIX are definitely going to require at some point for future games and applications given raytracing seems to becoming more of the norm these days, so I do hope they and up adding it.
Device/Vendor Agnosticism
I don't have a full solution for this right now, because I haven't needed it yet in my early testing. I've been able to have people send me traces from a NVIDIA GTX 1660 and me replay it on my NVIDIA RTX 2060 Super (I don't actually own Assassin's Creed Valhalla.) However this is something that I will need to solve as when trying to play back traces with vkd3d-proton that were recorded with native D3D12, sometimes the limits and image requirements don't match up.
I am going to try and experiment with adding some padding to the image requirements returned by D3D12 for now, and also see what other limits may need to be padded out from there by replaying it on different devices and vendors.
I could also intercept CreatePlacedResource, and forward it to CreateCommittedResource, which would avoid the image requirement problem but that also creates some disparity with what the app is actually wanting to do and what we are doing, which may hide real app bugs from being captured (ie. with aliased resources).
Fences and Synchronization
To deal with fences and synchronization, I essentially just have a big hashmap of all the currently pending events passed to SetEventOnCompletion. On the capture side, currently I just hook WaitForSingleObject[Ex] and WaitForMultipleObjects[Ex] with an Import Address Table Hook. When they are called, I look up each given object in my hashmap and mark a WaitFor command with the given events that are related to fences (if any.)
On replay, I create a new event for SetEventOnCompletion and pass that in instead and store it in the hashmap with the key being the original event. When I replay a WaitFor, I simply just look up the event(s) in the table and replay the appropriate command.
To ensure consistent synchronization, I also have to wait on GetCompletedValue if the actual fence on replay is behind the traced fence.
result = this->GetCompletedValue();
UINT64 traced_result = call.ret->toUInt();
if (result < traced_result)
{
    HANDLE wait_event = CreateEventEx(NULL, FALSE, FALSE, EVENT_ALL_ACCESS);
    this->SetEventOnCompletion(traced_result, wait_event);
    WaitForSingleObject(wait_event, INFINITE);
}
One minor thing that came up when tracing synchronization is that sometimes there'd still be races if one thread was calling methods with fences and another one was at the same time due to the bubble of time between recording and executing the command. To solve this I simply just locked a mutex at the start of every method that contained a fence.
There is a slight problem with my current method with the IAT hook, as IAT hook only hooks only hook the module of the executable, not if any other modules (DLLs) are calling it. To solve this I might try using a Detour hook but I haven't gotten around to trying that yet.
Dealing with API Jank
CreatePipelineState is simply terrible. There exists so many other ways of doing this such as Vulkan's pNext method, however Microsoft decided to use the most annoying way of encoding pipeline state imaginable, a polymorphic object stream. I wouldn't be as frustrated if it could simply be treat as an opaque blob, but it contains COM pointers, descriptor handles, etc. So it needs unwrapping to be serialized and sent to D3D12, and on replay we need to re-make this dumb object stream and re-wrap.
The code for this is not exactly clean, and the generated code is even less clean, a lot of which is because of the annoying alignment requirements that comes with it and the lack of including the type in the object header structure.
The stream essentially looks like this:
[type]
[empty space to meet alignof(structure1)]
[structure1]
[empty space to align to void*]
[type]
[empty space to meet alignof(structure2)]
[structure2]
[empty space to align to void*]
...
To serialize this for caputre, I simply do one pass where I find out the number of structures in the stream, N, and then have write an traced-array containing N * 2 elements, and put in the type and structure each time. APITrace captures allow you to mix types in arrays which is very handy (and also essential for serializing unions and other polymorphic types.)
I guess this is a nicer solution than an opaque blob anyway as this also allows you to introspect the pipeline state in qapitrace which may be useful for debugging purposes.
Conclusion
Hopefully this outlines why this is a useful project (at least for us) and how this all works right now!
There are still some obvious issues such as lack of 11On12 and ImportExistingHeap support and needing to improve hooking right now but I am hoping to work on fixing some of these soon.
For raytracing, I hope that there can also be a solution for the VA in buffers problem fairly soon, as it'd not only help with our bringup of DXR applications in vkd3d-proton a lot, and it'd also benefit a lot of other tools users such as RenderDoc etc and probably with bringup of raytracing in RADV.